It’s been a while since the first version of numpy-stl and a lot has changed since.
Most importantly, usage has become even easier. So here’s a demo on how to use matplotlib to render your stl files:
[python]from stl import mesh
from mpl_toolkits import mplot3d
from matplotlib import pyplot
# Create a new plot
figure = pyplot.figure()
axes = mplot3d.Axes3D(figure)
# Load the STL files and add the vectors to the plot
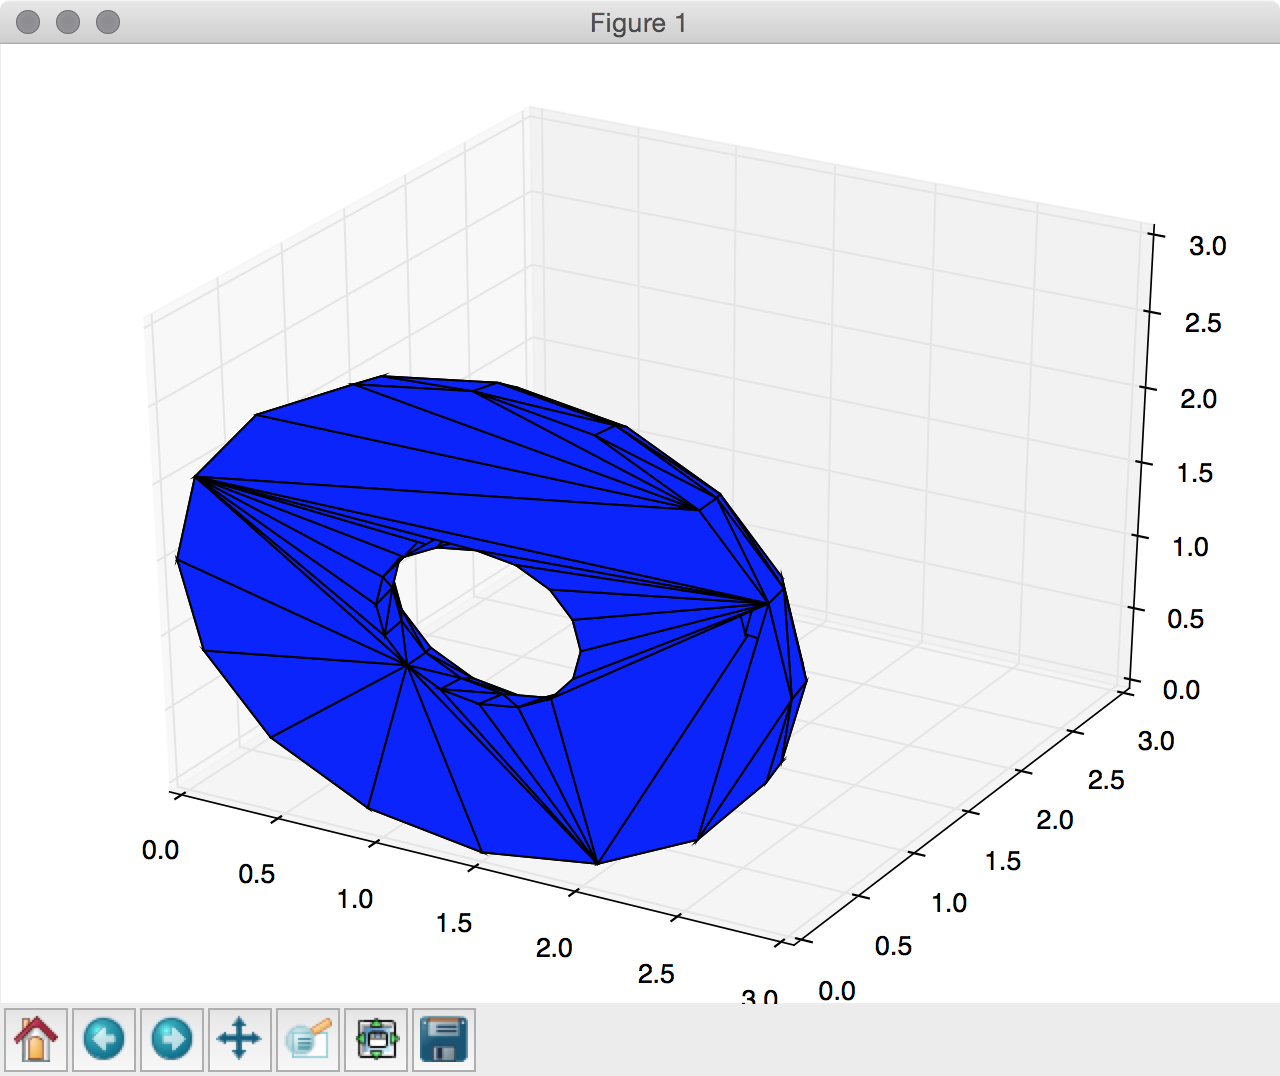
your_mesh = mesh.Mesh.from_file(‘tests/stl_binary/HalfDonut.stl’)
axes.add_collection3d(mplot3d.art3d.Poly3DCollection(your_mesh.vectors))
# Auto scale to the mesh size
scale = your_mesh.points.flatten(-1)
axes.auto_scale_xyz(scale, scale, scale)
# Show the plot to the screen
pyplot.show()[/python]
You can make the render prettier yourself of course, but it is certainly useful for testing.