It’s been a while since the first version of numpy-stl and a lot has changed since.
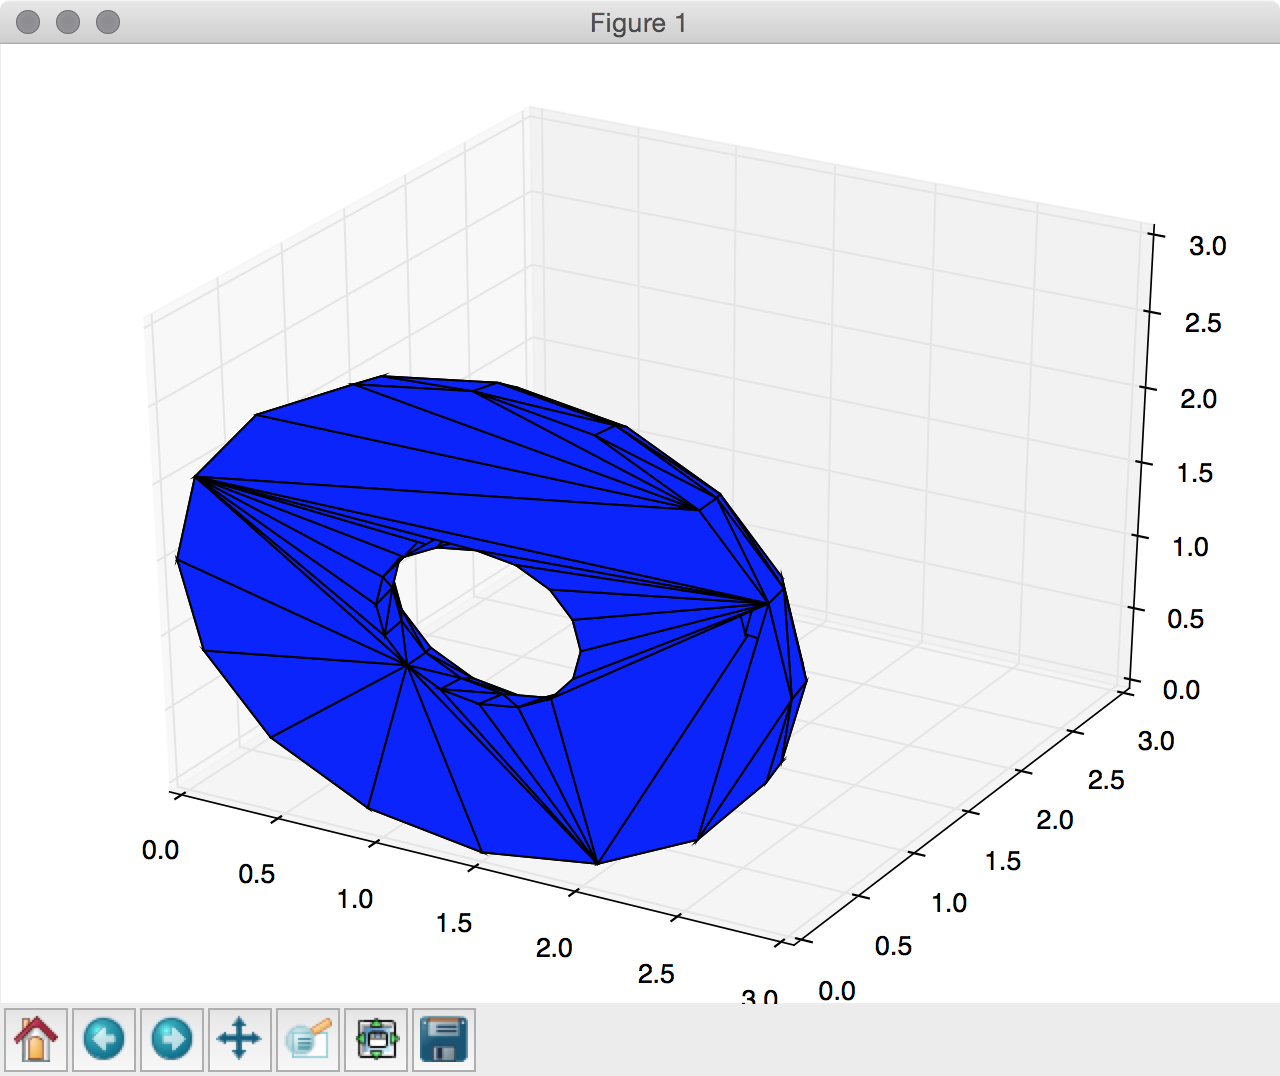
Most importantly, usage has become even easier. So here’s a demo on how to use matplotlib to render your stl files:
from stl import mesh
from mpl_toolkits import mplot3d
from matplotlib import pyplot

# Create a new plot
figure = pyplot.figure()
axes = mplot3d.Axes3D(figure)

# Load the STL files and add the vectors to the plot
your_mesh = mesh.Mesh.from_file('tests/stl_binary/HalfDonut.stl')
axes.add_collection3d(mplot3d.art3d.Poly3DCollection(your_mesh.vectors))

# Auto scale to the mesh size
scale = your_mesh.points.flatten(-1)
axes.auto_scale_xyz(scale, scale, scale)

# Show the plot to the screen
pyplot.show()
You can make the render prettier yourself of course, but it is certainly useful for testing.

Hi Rick,
I have a question regarding rendering a stl file with python, do you think is possible to measure distance on an irregular stl model captured with a 3d scanner?
I look forward for your answer
Kind regards
Luis
Hi Luis,
Technically it’s not impossible of course but it’s definitely not that easy to do right. You need to filter out incorrect data and fill missing information which makes it very difficult. It’s definitely outside of the numpy-stl scope for the time being but you could easily use numpy-stl to do the processing using numpy and matplotlib.
Best, Rick
Hi Rick,
Thanks a lot for your answer, but this is what I’m trying to do, to specify, I have a stl model of a welding bead, which I obtained from a 3d scanner and I would like to obtain its dimension (height and widht of the bead) . I was thinking of cutting many cross section measure this sections get their values and then obtain the mean and the standard deviation, but I don’t have any clue of how can I do this in Python, so any little help is welcome.
I look forward for your answer
Thank you
Luis
I think one of the easiest solutions would be to store all of the points in an kd-tree or octree. From that point on you can easily process the object bit by bit. Although instead of layers it will be clusters of points which are most likely more useful anyhow.
It’s a bit outside of my expertise though and I have no idea if that’s the most convenient solution.
A quick google gave me this overview, it could be helpful: http://www.meshrepair.org/
Once we have some free time, we definitely should get working on integrating my (Python 2.7) code.
It includes mesh repair and automatic rotation to optimal print direction. (based on heuristics which are sort of complicated, but expert-validated for > 200 objects)
To then obtain dimensions would be as simple as (object[X].max() – object[X].min()). 😉
hi
I have two stl files of with two organs data of original MRI file . How I can merge to stl files to get the part I needed
Thanks
Sagar
The simple solution is to read both files and simply write it to a new file. Something along the lines of:
Note that this will require you to have enough memory to keep both of the original models in your memory twice.
This is definitely not the fastest solution since you’ll be parsing the data while copying it. A much faster solution would be to simply concatenate the files and merge the headers. That’s a bit outside of the scope of this project but it’s actually not that hard to do.
For the binary stl format you simply need to add the sizes of both files to eachother (bytes 80 to 84) and concatenat bytes 84 till the end of both files to the new file.
For the ascii format it’s pretty similar, you need to skip the “endsolid …” line for the first file and skip the “solid …” line for the second file and beyond that you can simply concatenate.
HI Rick,
I am trying to run the numpy-STL examples and when I try to load an STL I get:
ValueError: incompatible dimensions for cross product
(dimension must be 2 or 3)
could you tell me what I am doing wrong?
Thanks
Without seeing the code I can’t be sure what’s causing it. The only parts of the code that generate cross-products are the remove_empty_areas method and the update_normals method.
Can you create an issue at the Github repository with the code? I’m guessing you’re specifying the data incorrectly somehow but I can’t be sure.
Add Github Issue
is it possible to make numpy-stl compatible with python3?
Thanks!
It is Python 3 compatible, tested on Python 3.4, 3.5 and 3.6 actually 🙂
Thank you for reply. I am a bit new to python…It seems I can install in python3 now.
but when I try to install in my python 2.7 environment, it seems the enum module has no enum.IntEnum. and I tried to install the flufl.enum and modified ‘import enum’ to be ‘import flufl.enum as enum’. Then when I try to run the example code to get stl file, I got an error
I got the error message:
where xxx is where my python being installed.
Am I totally wrong at somewhere?
Thanks!
Normally installing should be as simple as
pip install numpy-stl, that should automatically install the enum module as well. The flufl.enum is not the right one at least, you need the enum34 module: https://pypi.python.org/pypi/enum34Thanks Rick. seems I had an Enum module installed before. It’s ok after it is uninstalled.
hi, i am wondering if your work can help me not reading STL files but exporting my 3Dcurves to STL ? i am new to matplotlib and i am wondergin wether i can use mplot3D to create objects destinated to a 3D printer
thanks
Vincent
The problem with mplot3d objects is that they are point based, whereas stl files use triangles instead. This can be converted through triangulation but that’s something you need to do using matplotlib.
Saving with numpy stl is pretty easy after that, only the triangulation can be challenging
Hi Rick,
Thanks for the amazing work. I am new to stl files but being able to work with python, it’s increasing my understanding.
I also wanted to ask the same question as Vincent. I have plots of ~2500 points in one trajectory and would like to convert it to .stl. You mentioned that I would have to use matplot to make it triangular based, but could you give me a bit more further idea on how to do it?
Also, is it possible to find intersection of the plot (in matplotlib) and the object imported as stl file?
Hi,
I am trying to compute the curvature and i have big trouble because my workpiece is 3 000 000 triangles and stl files are not sorted.
Do u have and idea of how i could do?
Thank u.
I would personally start with qhull for some preprocessing but this might be too much for qhull as well.
I’ll try it and let you know, thank you for answering quicly!
Hi,
I know you said numpy-stl is compatible with python 3.6, however I’m having some issues installing it in a virtual environment with python 3.6. I have tried the simple: pip install numpy-stl, and have tried uninstalling any other packages called stl (I didn’t have any installed). When I try the following:
I get the error: no module named ‘stl’
I’m assuming I may need to install this using conda install, but I guess all of the links and examples that I have found have been pretty old for this (vers 1.8), and I keep getting an error about there needing to be a certain type of json present in the source for conda 4.3 to use it.
Do you have any recommendations for me for installing via conda and why this is happening?
Thanks!
Hi,
I want to obtain the coordinates of all vertices in a stl. How should I proceed with numpy-stl?
I tried with “my_mesh.points” but its output is not exactly what I want.
Could you help me?
Thanks!
Hi RICK,
I am a new user on numpy-stl, I am trying to using numpy-stl to reduce the stl file range, for example, making my mesh size from 5*5 to 2*2 by delete the values outside my choose.
Do you have an idea of how i could do?
Thank you.
Menro
RICK,
I have solved it now ,
Thank you all the same.
Menro
Hi Rick,
Thank you for the numpy-stl library.
I could very easily use this lib along with ipyvolume in order to visualize object from STL file.
You may find an example here: https://www.yotta-conseil.fr/spinning_cube.html#Spinning-Cube-STL
Best regards,
BTW I wrote the full story in French on Medium:
https://medium.com/@fran6w/le-cube-en-rotation-96b136175f5e
Hi Francis,
Thank you so much for the post. My French isn’t great but it looks great as far as I can see 🙂
I have frames of Dicom images from every angle, how can I make it into 3D?
As is the case with many of the questions here, you’ll need to do triangulation to convert your slices into a 3D model. Not something I can help you with unfortunately, that goes way outside the scope of this project.
Hi Rick,
I have a question, how to mesh under a 2D matplotlib plot and then convert it into an stl file?
For instance, I have a y array and a x array and I want to mesh the bondaries of this domain from y to 0 and from x0 to the last x element.
I would I go around using this package?
best regards
PG
Hi Rick, nice work with the numpy-stl. It looks like the right tool for what I try to do. I’ve bought myself a cheap 3016 CNC milling machine. Now I want to convert STL files into gcode which I could feed to the CNC machine. To do that I need to go through the 3D object in a stretched cube pattern (line by line depending on the with of the milling head, etc.), looking from the top downwards. Which means I need to test if that rectangular contains any parts of the 3D object from the STL file. Therefore my question to you: What would be the most efficient way to probe a “collision” with the 3D object? Any hint is very much appreciated.
Hello Rick.
Thank you for the numpy-stl library. I have just downloaded it and it could be very useful for my work. I just have 2 questions.
1. Is it possible to obtain a 3D numpy matrix from the STL part where empty is 0 and positions of the part is 1, for example? That is, a 3D numpy matrix obtained with meshgrid :
x = np.linspace(0,10,50)
y = np.linspace(0,10,50)
z = np.linspace(0,10,50)
xx, yy, zz = np.meshgrid(x, y, z, sparse=False)
# zz.shape -> (50, 50, 50)
part=np.zeros_like(xx)
# part -> fill with 0 and 1 according to the stl part
2. I have tried to execute yous examples and I got this bu:
‘ValueError: Non-string object detected for the array ordering. Please pass in ‘C’, ‘F’, ‘A’, or ‘K’ instead’
Thank you very much in advance
Luis Miguel
Hi Rick,
Is there a reason why the max amount of triangles to read from binary files is 1e8 (stl.py line 45)? I have some files that are larger than that and would like to use your library.
Thanks.
It is very unlikely that you have files larger than that. Usually this error is caused by corrupt or incorrectly read files instead.
Hi. I am very glad to find your script for STL generation. I am wondering if I can use your numpy-stl for the development of my own CAD design software? How free I am to sell it? Thank you!
The library uses the 3-clause BSD license so it’s pretty free and open. But attribution is much appreciated 🙂
Hi Rick,
Congratulations for your grate job with numpy-stl.
A have a doubt. I want the same effect of your picture, showing triangles (facets) in the surface. But in my version I can’t. Can you help me?
Thanks a lot!
Clayton
It might be more useful to open an issue or discussion on the Github project instead with your code, that is easier than discussing it over here 🙂
hello i got these errors in pythom 3x
The flatten function only takes an order as a parameter. Usually you don’t have to change that so I would suggest using
...flatten()instead of...flatten(-1)Docs: https://numpy.org/doc/stable/reference/generated/numpy.ndarray.flatten.html
Hey,
It seems to have changed the actions a bit. When I put 1 on a scale it gives me an error and it forces me to enter a signal. Which creates a really large scale. How can I change it to a smaller scale?
I want the image to be 3d and that I could move it and get to all the points. Do you know how it is possible?
You can use
matplotlibto show the image as is shown in this post. Beyond that I’m not sure what you are trying to ask.Scaling a mesh is pretty easy, the structures are regular numpy arrays so you can do something like:
mesh.vectors /= 10Hi Rick,
I am a new user of numpy-stl. I have generated a 3D stl file from an image of size 1024,1024,3 which i have converted to a grayscale image so its a single channel 2D array using python.
I want to extract the height associated with each of the image pixel in 2D.
For example what is the height from the stl file at pixel location 100,50?
Can you please help with how to approach something like this
An STL is comprised of triangles, not pixels so it would depend on how you have mapped them. But beyond that, if you have it in a `numpy-stl` `Mesh` object you can do `mesh.z[some_point] – mesh.z.min()` to get the height for that specific point.